Opengl Profiler
Advertisement
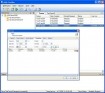
XSQL Profiler
xSQL Profiler is an easy to install, easy to use, agent-less SQL Server monitoring tool that can be utilized for performance, auditing and compliance related tasks. Monitor multiple SQL Servers from one central location - choose SQL Servers and databases
Advertisement
Space Invaders OpenGL v.0.6.1
Space Invaders OpenGL is a perfect clone of the original Martians killer Space Invaders, the legendary arcade game that was born in 1978. But this clone version is specially programmed to take advantage of the full power of 3D machines today.
OpenGL Extensions Viewer v.2.32.226
OpenGL Extensions Viewer displays the vendor name, the version implemented, the renderer name and the extensions of the current OpenGL 3D accelerator. Also features OpenGL rendering test from OpenGL 1.1 to 3.
ANTS Performance Profiler v.6.3.0.147
You can use ANTS Performance Profiler to identify performance bottlenecks within minutes and optimize .
Karen's Computer Profiler v.2.5.0.3
Karen's Computer Profiler is an interesting software for those who are interested in discovering the specifics of their computer. It gives even minor information about memory, CPU, and operating system of the computer.
ProFiler MP3i v.2.0.0007
With ProFiler MP3i you can perform all basic administrative tasks and much more, like zipping, scanning, screen capturing, internet radio, multi format audio player, multi format converter and so on.
Wizart Profiler v.2.31
Profiler is intended for designers of various network's types, connecting terminals, etc. It helps with entering particular profile node data, automatically determining certain values, until a profile drawing is generated.
OpenGL Extension Viewer v.4.0.5 Build 4.0.0.0
OpenGL Extensions Viewer displays the vendor name, the version implemented, the renderer name and the extensions of the current OpenGL 3D accelerator.Displays information of the current OpenGL 3D accelerator.OpenGL Extensions Viewer runs on Windows,
VBA Code Profiler v.2.4.7
The VBA Code Profiler System (VBACP) provides a system to profile MicrosoftT« VBA based applications.
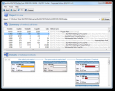
DbForge Event Profiler for SQL Server v.1.8.11
dbForge Event Profiler for SQL Server is a FREE tool that allows you to capture and analyze SQL Server events. The events and data columns are stored in a physical trace file for later examination.
EQATEC Profiler
EQATEC Profiler is an easy-to-use .NET code profiler. Some key features are: Profile any .NET 2.0+ application; Only code profiler for .NET Compact Framework; Comes with a command-line version too; Use precise instrumentation to present a full method-call